 |
 |
||
 |
| Independent and Objective Investment Advice for Nearly a Quarter of a Century | ||
|
|||||||||||||||||||
|
|
||||||||||||||||||
Sample Report - Page 1 Sample pages Sample page 2
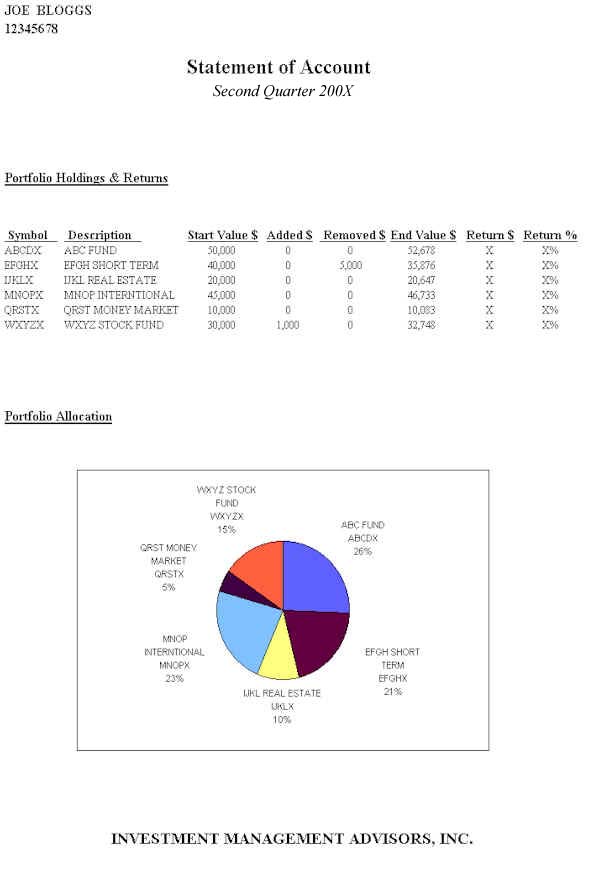
The first page of our client reports has shown how each individual security portfolio performed during the current time period. Also given is information on money removed or added to each holding. The bottom portion of the page contains a fund allocation pie chart. This chart gives a visual description of how client assets are divided among the various funds in the portfolio. In this example fictitious mutual fund names, ticker symbols and allocations have been provided. The spaces for return numbers have been left blank. This depiction is for example purposes only.

See Disclosure Statements on home page and disclosure page of this website